The images of an inundated New York City certainly were eye-catching. But it isn’t until you start parsing the data that you start to really understand how bad things got for the East Coast.
Some of the most startling stats: winds pegged at 90 miles an hour when Sandy made landfall as a tropical storm. It left 185 dead between Jamaica and its terminus in the US. It was the second costliest hurricane in recorded history after Katrina, with $52.4 billion in damages.
Five thousand commercial airline flights cancelled. Across 26 states, up to 80 million were affected.
Eight and a half million people without power after the storm.
Even 11 days after the storm, with freezing winter temperatures closing in,
428,000 in New York and New Jersey remain without power.
Aon Benfield, an insurance broker that specializes in catastrophe management, crunched the numbers and found something just as remarkable about hurricane/tropical storm Sandy. Well, perhaps not so much about the storm itself, but how it fits into recent weather events and climate change in general.
“Devastating Hurricane Sandy was the eleventh billion-dollar weather-related disaster in the U.S. so far this year, and the most expensive,”
wrote Wunderground.com’s Jeff Masters, of Aon Benfield’s latest report. “This puts 2012 in second place for most U.S. billion-dollar weather disasters behind 2011, when NOAA's National Climatic Data Center (NCDC) counted fourteen such disasters.”
Meanwhile, climate scientists noted that not only did global warming make such a historic slew of storms possible, it also made the sea level rise, thus increasing the damage to coastal areas.
“Sandy threw the ocean at the land, and because of global warming, there were about eight inches more ocean to throw,”
wrote Chris Mooney on The Climate Desk. “As the water level increases, the level of damage tends to rise much more steeply than the mere level of water itself.”
When Thailand was flooded in 2011, the government contracted a drone to scout out where flooding had occurred, which helped make decisions about where and when to release flood gates. The contractor flew more than 60 flights over a period of 45 days,
and claimed that the data obtained from those flights helped prevent the city of Bangkok from suffering more during that catastrophe.
That same year, back in the states, freelance journalist and storm chaser
Aaron Brodie took sweeping shots of the Jersey Shore with his own multicopter before and after Hurricane Irene.
He uploaded this footage on YouTube, but amended his post after Sandy:
“Irene was child's play in comparison to Superstorm Sandy. In fact, there was no real damage from Irene,” Brodie wrote.
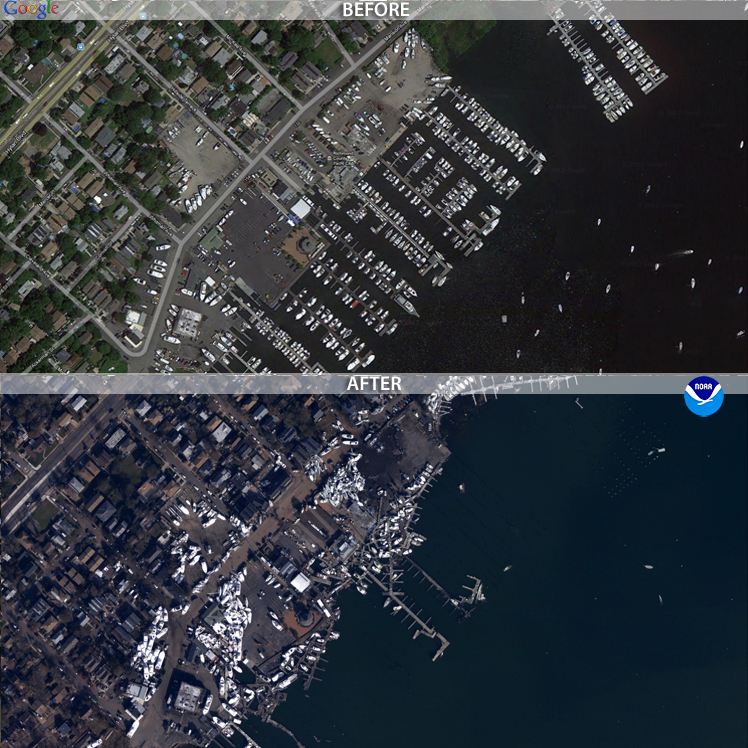
The public wasn’t able to obtain coverage from drones for Sandy. Some news sites did, however, post before and after photos of New York and New Jersey. These post-sandy aerial photos were obtained by the National Geodetic Survey, with the help of NOAA’s
King Air and
Twin Otter remote-sensing aircraft. The photos were set side-by-side with historic satellite imagery,
allowing users to drag these images to do their own comparisons.
Because of the prohibitive cost of aerial photomapping, these images were gathered by government agencies. But, if FAA regulations allowed it,
the job could have easily been done with a $1,000 aerial drone. That puts it within reach of even independent and backpack journalists. Or concerned members of the community.
If the climate models hold true, there’s going to be more “superstorms” like Sandy every year. There will be more billion-dollar disasters, more lives lost, more power outages, and the public will need more information about how those disasters are affecting their communities.
Drones are especially capable of giving quick data on the scope, or extent, of large-scale disasters. Now is the time for journalists to learn and perfect tools like the drone to give the public that information.
Photo at the top of the post is of post-Sandy flooding in Haiti, via the Flikr photostream of United Nations Stabilization Mission In Haiti.


